ID 411410
Лот 3 | Portolan Chart of the Mediterranean
Оценочная стоимость
$ 40 000 – 60 000
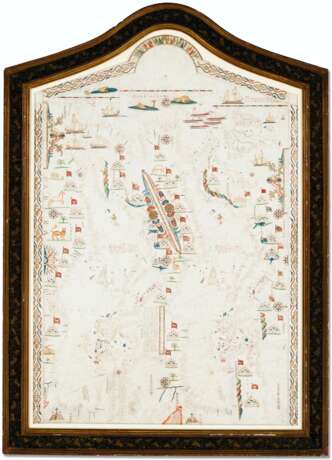
Attractive, richly decorated, and very unusual double portolan chart of the Mediterranean, linking the medieval and modern. Ever since the Europeans’ landing in America, the phenomenon of magnetic declination had been observed empirically by sailors and it often implied very challenging departures from their earlier charts. Nevertheless, the vast majority of sailing charts continued to be drafted with no reference to the new observations. For example, it was not until the late 16th century that hydrographers started to correctly adjust the axis of the Mediterranean in their maps. Joan Oliva tackled the problem in his 15-chart atlas produced in Messina in 1614, rotating the axis an average of nine degrees clockwise; this seems to have been the generally accepted view at the time, in competition with the calculations of Bartolomeo Crescenzio or Gerolamo Costo.
The present portolan represents a committed attempt to adapt an honoured but by then obsolete tool, the medieval portolan, to the facts of early-modern navigation. It shows the features of a traditional portolan, with ample space for medieval bestiary and typified representations of places, but also a chart which records the relative positions of land masses more accurately than the traditionally-calculated angles. The main body of the chart is divided in two to show both the medieval and corrected views of the Mediterranean, enabling the owner to compare them directly. The corrected axis shows Crete and Cyprus aligned on the same parallel. Joan Oliva produced a very similar chart to this one the next year, in Livorno. The two charts have the same essential layout but the decoration in the present example is considerably richer, linking it more closely to the medieval tradition. The similarity of the 1617 and 1618 portolans has led scholars to surmise that even though this example is signed by Placido Caloiro y Oliva, it may rather be the work of Joan Oliva and then embellished by his family member after Joan Oliva departed Sicily. See Simonetta Conti, “Un’originale carta nautica del 1617 a firma di Placidus Caloiro et Oliva,” Geografia 9 (1986), pp. 77-86 (this map); and Corradino Astengo, “The Renaissance Chart Tradition in the Mediterranean,” History of Cartography, vol. 3, part 1 (2007), pp. 174-262.
Manuscript portolan chart, ink and colors on vellum, 921 x 627mm (sight size). The chart extending from Ireland to the tip of the Red Sea, from the Canary Islands to the Black Sea, taking in the coastlines of France and Spain, the shore of Morocco, and a double chart of the Mediterranean coastline plus a portion of the Black Sea coast. Coastlines drawn in brown ink, principal rivers marked, coastal names in red and brown in a small neat hand, city drawings with banners (four European cities individuated), decorated with sea monsters, sailing ships, galley ships, several land animals (lion, camel, unicorn, deer), palm trees, compass roses, rhumb lines in green, red, and brown; the whole in a foliate border of red, blue and brown. (Some soiling at top and bottom, some overall rubbing/fading chiefly at top and bottom.) Handsomely displayed in a sympathetic frame (unexamined out of frame).
| Адрес торгов |
CHRISTIE'S 8 King Street, St. James's SW1Y 6QT London Великобритания | |
|---|---|---|
| Предосмотр |
| |
| Телефон | +44 (0)20 7839 9060 | |
| Комиссия | see on Website | |
| Условия использования | Условия использования |


